Toolless lazy loading and micro-frontends (part 2)
In the previous part I've introduced you to a method of modularizing a single page within an MPA architecture into multiple units by using a custom lightweight asset loader. Because the goal of the modularization was to parallelize work, I'm simulating a situation where multiple teams (or multiple individual developers) are working on the same page with virtually no knowledge of each other's current work. Last time I've completed the first unit, and in this time, I'm going to complete the second unit and integrate the changes into the shared master branch.
Weather forecast
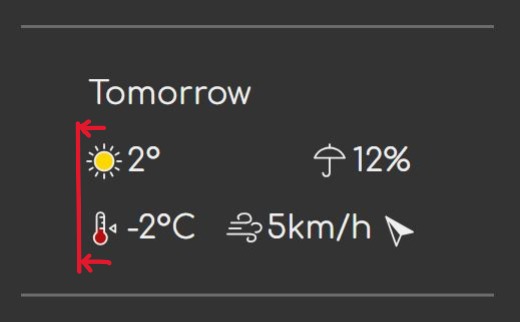
After reviewing the markup, I notice that humidity is not available as daily forecast data. This actually makes sense since relative humidity is calculated based on temperature and cannot be aggregated (average humidity doesn't mean much). For now, I think the more pragmatic choice is to omit it. This leaves me with only two tiles in the dialog. It makes no sense to have a modal dialog just for two tiles, so I'll also need to include these two pieces of data in the table and omit the dialog. One small oversight leads to work being wasted. Oh well.
Another small oversight is that the temperature for the day is, in fact, the maximum temperature, so that information is duplicated. The second column should only contain the minimum temperature, but it contains both right now. This should be a trivial fix.
I'm going to repeat this from time to time. It doesn't matter if I'm refactoring or writing new UI code, I generally follow the HTML → CSS → JavaScript routine, and occasionally HTML → JavaScript → CSS. These fixes are no exception. I'm fixing HTML first, then CSS, and then moving on to the JavaScript.
I'm changing the column headers to account for the two new columns, as well as the change in the role of the second column:
<th scope="column">Date</th>
<th scope="column">Weather and max temperature</th>
<th scope="column">Minimum temperature</th>
<th scope="column">Precipitation</th>
<th scope="column">Wind</th>
I'm slightly verbose here because these are not visible labels. They are only used by screen readers. On the other hand, I cannot be too verbose – table headers are possibly repeated over and over again as the screen reader user navigates through the table.
The data rows are changed like this:
<th scope="row" class="date">
    Tomorrow
</th>
<td class="weather">
    <x-icon class="icon" name="sunny"></x-icon>
    <span class="current-temperature">2°C</span>
</td>
<td class="min-temperature">
    <x-icon name="temp-min"></x-icon>
    <span class="value">-2°C</span>
</td>
<td class="precipitation">
    <x-icon name="precipitation"></x-icon>
    <span class="value">12%</span>
</td>
<td class="wind">
    <x-icon name="wind"></x-icon>
    <span class="speed">5km/h</span>
    <span class="direction-label alt-text">NW direction</span>
    <x-icon class="direction-graphic" name="wind-direction" style="--direction: 320"></x-icon>
</td>
I've also tweaked the class names a bit to make them more semantic and consistent.
The CSS underwent a more substantial change requiring the adjustments to layout. Instead of 4 columns, we now have 5. The padding columns on either side remain.
x-weather-forecast table {
    display: grid;
    grid-template-columns: 1fr repeat(5, auto) 1fr;
}

@media (width < 36em) {
    x-weather-forecast table {
        grid-template-columns: 1fr repeat(3, auto) 1fr;
    }
}

@media (width < 26em) {
    x-weather-forecast table {
        grid-template-columns: 1fr auto auto 1fr;
    }
}
The layouts are modified as follows:
x-weather-forecast tr {
    grid-column: 1/8;
    /* .... */
    grid-template-areas: "fl w1 w2 w3 w4 w5 fr";
    /* .... */
}

@media (width < 36em) {
    x-weather-forecast tr {
        grid-template-areas:
            "fl w1 w2 w4 fr"
            "fl fc w3 w5 fr";
    }
}

@media (width < 26em) {
    x-weather-forecast tr {
        grid-template-areas:
            "fl w1 w1 fr"
            "fl w2 w4 fr"
            "fl w3 w5 fr";
    }
}
Apart from accounting for the extra column, I've also added the left and right padding for the 2-column layout.
As before, I adjust the alignment of certain columns depending on the breakpoint.
@media (width < 36em) {
    x-weather-forecast .weather {
        justify-content: flex-start;
    }

    x-weather-forecast .temperature {
        justify-content: flex-start;
    }
}
This keeps the weather and temperature cells left-aligned when they are on the left.
I'm going to quickly refactor the CSS to collapse the media queries. Editing this code, I've realized that there's lots of synchronized media queries here, and that means it's better to have them as compact blocks than dispersed around the stylesheet. This increases the distance between the default variant and the ones in the breakpoints, but it makes adjusting breakpoints more reliable.
@media (width < 36em) {
    x-weather-forecast table {
        grid-template-columns: 1fr repeat(3, auto) 1fr;
    }

    x-weather-forecast tr {
        grid-template-areas:
            "fl w1 w2 w4 fr"
            "fl fc w3 w5 fr";
    }

    x-weather-forecast .weather {
        justify-content: flex-start;
    }

    x-weather-forecast .temperature {
        justify-content: flex-start;
    }
}

@media (width < 26em) {
    x-weather-forecast table {
        grid-template-columns: 1fr auto auto 1fr;
    }

    x-weather-forecast tr {
        grid-template-areas:
            "fl w1 w1 fr"
            "fl w2 w4 fr"
            "fl w3 w5 fr";
    }
}
Now I can move on to the JavaScript.
As before, I will first add the skeleton custom element. Then I'll do the JavaScript in two passes: overall flow first, then populate the UI in the second pass.
import {CustomElement} from './common.js'

customElements.define('x-weather-forecast', class extends CustomElement {
    setup() {
        // ....
    }
})
As before, I'm starting with the basic custom element setup. The rest of the
code will be within the setup() method unless otherwise noted.
I'm starting with the first pass.
let selectedPlace = JSON.parse(localStorage.selectedPlace || null),
    lat = selectedPlace?.lat,
    long = selectedPlace?.long,
    timezone = selectedPlace?.timezone

let nthDateAfterToday = n => {
        let d = new Date()
        d.setDate(d.getDate() + n)
        return d
    }

let displayError = () => {},
    displayForecast = data => {
        console.log(data)
    }

if (selectedPlace) {
    let startDate = nthDateAfterToday(1),
        endDate = nthDateAfterToday(11),
        http = new XMLHttpRequest()

    http.open('GET', `https://api.open-meteo.com/v1/forecast?latitude=${lat}&longitude=${long}&timezone=${encodeURIComponent(timezone)}&start_date=${localDateISO.format(startDate)}&end_date=${localDateISO.format(endDate)}&daily=weather_code,temperature_2m_max,temperature_2m_min,precipitation_probability_max,wind_speed_10m_max,wind_direction_10m_dominant`)
    http.responseType = 'json'
    http.onerror = displayError
    http.onload = () => {
        if (http.status == 200) displayForecast(http.response)
        else displayError()
    }
    http.send()
}
The code looks almost exactly like the one I wrote in the first unit. In
fact, it's pretty much the same thing except that displaySummary() is now
called displayForecast() and that the URL parameters are different.
Why haven't I factored this out? Well, remember, this is a simulation of parallel work done by multiple teams with minimal coordination. It could be that the other team is still not done with the first unit and this code doesn't exist yet. We are just using a time machine to go back and forth between different times. It's during code review that we finally learn that the other team was doing pretty much the same thing.
As with the last time, I'm starting with the displayForecast() function first.
let /* .... */
    displayForecast = data => {
        for (let i = 0; i < data.daily.time.length; i++)
            populateRow(getOrCreateRow(i), data.daily, i, data.daily_units)
    }
The function iterates over the data, and populates the rows. I'm starting
with a blank table which has no rows. So the first time I do this, I need to
create a row. To do this, I'm using a getOrCreateRow() function that looks
like this:
let template = this.querySelector('template').content,
    table = this.querySelector('.forecast-data'),
    getOrCreateRow = index => {
        if (!table.children[index]) {
            let row = template.cloneNode(true)
            table.append(row)
        }
        return table.children[index]
    }
The function looks up whether there's an element at the specified index, and creates one from the template. If the node is already there, it will keep it. The function returns the node which allows us to use it as a value in other places, such as in this case:
populateRow(getOrCreateRow(i), data.daily, i, data.daily_units)This keeps the code streamlined and compact making it more efficient and easier to read.
The populateRow() function looks like this:
let /* .... */
    populateRow = (row, data, index, units) => {
        row.querySelector('.date').textContent = getFormattedDate(data.time[index])
        row.querySelector('.weather .icon').name = getWeatherId(data.weather_code[index])
        row.querySelector('.current-temperature').textContent = `${Math.round(data.temperature_2m_max[index])}${units.temperature_2m_max}`
        row.querySelector('.min-temperature .value').textContent = `${Math.round(data.temperature_2m_min[index])}${units.temperature_2m_min}`
        row.querySelector('.precipitation .value').textContent = `${Math.round(data.precipitation_probability_max[index])}${units.precipitation_probability_max}`
        row.querySelector('.wind .speed').textContent = `${data.wind_speed_10m_max[index]}${units.wind_speed_10m_max}`
        row.querySelector('.wind .direction-label').textContent = `${getCompassDirection(data.wind_direction_10m_dominant[index])} direction`
        row.querySelector('.wind .direction-graphic').style.setProperty('--direction', data.wind_direction_10m_dominant[index])
    }
This code is not quite ideal. The line length has nothing to do with that,
though. 😅 The reason I believe it's not ideal is that it takes the entire
data object, which contains the daily forecasts for all days, and a separate
index. It's usually a bad idea to pass data to a function that it doesn't
need. In this case, though, my hand is almost forced by the shape of the
data returned by the API, and the shape of the data is pretty much ideal
from the standpoint of conserving bandwidth. It looks like this:
{
    "time": ["2025-01-27", "2025-01-28", /* .... */],
    "weather_code": [3, 51, 55, 55, 1, 51, 53, 55, 51, 51, 71],
    "temperature_2m_max": [17.6, 16.9, 14.9, 16, 14.9, 17.1, 6.4, 4.1, 1.8, 2, 3.2],
    "temperature_2m_min": [7.9, 10.3, 6, 5.2, 3.9, 4.4, 4.1, 1.4, 0.9, 0.9, 0.9],
    "precipitation_probability_max": [6, 24, 49, 34, 12, 22, 27, 27, 17, 20, 12],
    "wind_speed_10m_max": [15.1, 19.5, 11.3, 15.5, 8.4, 14.7, 13, 15.7, 14.5, 13.8, 13],
    "wind_direction_10m_dominant": [173, 155, 150, 130, 192, 163, 307, 252, 256, 259, 271]
}
Now imagine an alternative that repeats the long key names for each item in the array:
{
  "daily": [
    {
      "time": "2025-01-27",
      "weather_code": 3,
      "temperature_2m_max": 17.6,
      "temperature_2m_min": 7.9,
      /* .... */
    },
    /* .... */
  ]
}
This would result in a much larger payload.
I could write a small abstraction that helps me restrict access to the data for the function. Something like this, for example:
let dataAtIndex = (data, index) => new Proxy(data, {
        get(target, key) {
            return target[key][index]
        }
    }),
    d = dataAtIndex(d, 1)

d.weather_code // => 51
This proxy restricts the access to the specified index so effectively the function cannot obtain data that it shouldn't have access to.
This can be done with even less code by using function binding:
let getDataAtIndex = (data, index, key) => data[key][index],
    getData = getDataAtIndex.bind(null, data, 1)

getData('weather_code') // => 51
I'm opting to avoid this kind of complication because:
- The function having a bit more access isn't the biggest deal in the world in this case.
- The abstraction requires understanding the principle of least authority, which makes the code harder to read for some developers, the trade-off is not worth it because of the previous point.
The code related to date formatting looks like this:
// Date format
let DAY_MS = 86_400_000,
    localDateISO = new Intl.DateTimeFormat('en-CA'),
    localDateShort = new Intl.DateTimeFormat('en-US', {month: 'short', day: 'numeric'}),
    localDayOfWeek = new Intl.DateTimeFormat('en-US', {weekday: 'long'}),
    getFormattedDate = dateStr => {
        let [year, month, day] = dateStr.split('-'),
            forecastDate = new Date(year, month - 1, day),
            today = new Date()

        today.setHours(0, 0, 0, 0)

        switch ((forecastDate - today) / DAY_MS) {
            case 1:
                return 'Tomorrow'
            case 2:
            case 3:
                return localDayOfWeek.format(forecastDate)
            default:
                return localDateShort.format(forecastDate)
        }
    }
No MomentJS, no Day.js, no nothing. Just plain Date and Intl
APIs. There are obviously some trade-offs, such as the nthDateAfterToday()
function I've shown you earlier – whopping 5 lines of code I had to write. 😱
The functions for formatting weather data (getCompassDirection() and
getWeatherId()) are identical to the ones I implemented in the other unit.
I've got no choice but to duplicate them here because the other branch isn't
merged yet. In fact, I technically don't even know about them yet, and they may
not have been written at all yet in out simulation.
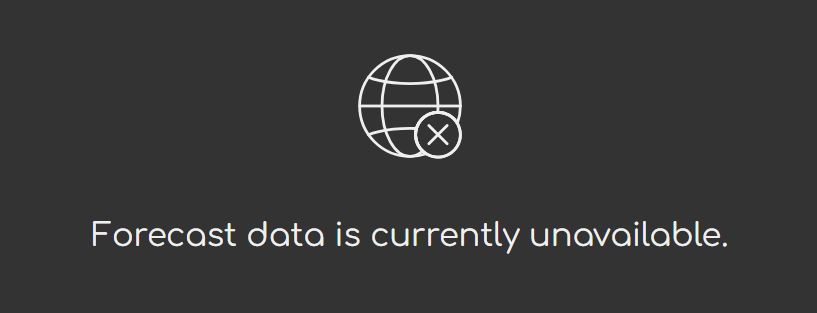
Now I can move on to the displayError() function. My initial plan for this
feature was the do the same thing I did for the tiles in the summary
section: show a "disconnected" icon. However, the number of cells in the
table would make that look a bit silly. Instead, I'm going to show one large
"disconnected" icon instead of the table. To do this, I need to first go
through the HTML and CSS.
To the table itself, I add a class so I can select it more reliably in the JavaScript:
<table class="forecast">
    <!-- .... -->
</table>
Below the table, I'm adding a hidden <div> that will hold the content shown
when data is not available.
<div class="no-data" hidden>
    <x-icon name="disconnected"></x-icon>
    <p>Forecast data is currently unavailable.</p>
</div>
I'm going to use the hidden attribute on the <table> element, so I'll
need to mask the CSS so it doesn't interfere. Namely, the hidden attribute
only works visually if the element has no display property, and my table
has one.
x-weather-forecast table:not([hidden]) {
   display: grid;
    /* .... */
}
Adding a :not([hidden]) pseudo-class takes care of that.
As for the actual message, I'm going with the usual flex layout to keep it neatly centered, and add some spacing between the icon and the text.
x-weather-forecast .no-data:not([hidden]) {
    display: flex;
    justify-content: center;
    align-items: center;
    flex-direction: column;
    gap: 1em;
    padding: 2em;
}

x-weather-forecast .no-data x-icon {
    --icon-stroke-width: 0.5px;
    font-size: 300%;
}
If you're wondering why the gap is 1em and the padding twice as much, read
up on the Proximity Gestalt principle.
I'm adjusting the stroke width of the icon because I don't want the strokes to be too thick as the icon size is increased. This branch doesn't have the icon to begin with, so I'm also updating the spritesheet. This is another bit of duplication.
I can bring up the .no-data section by simply removing its hidden attribute
in the dev tools. I can also add the hidden attribute to the table to test it.
(You should generally always test these in the dev tools while working on the
CSS.) You've seen me do things like this before – poke at the dev tools to test
some UI behavior by manipulating the DOM the same way I would in JavaScript.
When you're doing vanilla, the standard tools like the browser dev tools or your
IDE become a bit more useful.
Lastly, I'm updating the JavaScript.
let forecast = this.querySelector('.forecast'),
    noData = this.querySelector('.no-data')

let displayError = () => {
       noData.hidden = !(forecast.hidden = true)
    },
    displayForecast = data => {
       forecast.hidden = !(noData.hidden = true)
       // ....
    }
The double-assignment is a pattern I use a lot when it comes to this type of situation – one value being the opposite of another one. I'm not doing this to save some characters or lines of code. I do this specifically to clarify and guarantee the relationship between these values.
If you are unfamiliar with how assignment works in JavaScript, you should know that it's an expression, not a statement. As any expression it has a value, and the value of the assignment expression is whatever is on the right hand side.
If we take one of the double-assignments and evaluate it step by step, we get:
noData.hidden = !(forecast.hidden = true)
// =>
noData.hidden = !true
// =>
noData.hidden = false
// =>
false
I'm disabling the network temporarily to check that this works... and it does.
The commits
Now it's time to commit the changes. I'm playing dumb again and pretending I don't know anything about the work that was done in the other branch.
I've made a small fix to the .gitignore file, so I'm committing that
separately. I'm also committing the updated icon spritesheet as a separate
commit. Of course, all of the work done on the actual feature is also committed.
It's time to merge the changes.
The merge
We have three teams in the race. The first team was working on the place label at the top of the page. The second team was working on the weather summary. The third team on the forecast.
The first team submits the PR first because it only had minor changes. The merge goes without a glitch. The other teams review the changes. Everything looks good.
After a while, the second team prepares to submit the change. It rebases its own branch on top of the master branch. No issues. The teams review the changes, and the third team sees there's duplicated code, and some duplicated commits. Now they need to make a decision. What do they do with the code? Do they refactor now or later? Which team owns the refactor and the resulting shared code? How will the shared code be made available? They already have 3 JavaScript modules on this page. Would a 4th one be too much? Should they start bundling? Lacking an obvious way forward, the teams decide to snooze this decision and merge the code as is. "We're doing vanilla, remember? Our payload is tiny. Don't worry about it.", they say. (Don't look at me. 😅)
The time comes for the third team to submit a PR. They rebase the branch on top
of the master. Uh oh... merge conflict in the icon.svg file. The spritesheet
is all in one line, so it's hard to tell what the conflict is if you don't know
what you're looking for. The teams schedule a meeting and after a discussion,
they identify the issue: the third team added support for the
--icon-stroke-width custom property that was missing on the master branch.
They decide to go with the spritesheet from the third team. Whew!
Since the icons are now merged, the third team notices that the second team didn't address the stroke width in their large tile. They can't touch that code because it belongs to the second team, so they file a bug report. Hopefully someone will see it before the release. 🤞
After a code review, the changes are merged. The second team scrambles to fix the stroke width issue...
Conclusion
With this part completed, you have witnessed the full glory of the modular design. And some of its many shortcomings. The idea that you have multiple teams working in isolation sounds like a good way to parallelize work, but some of the benefit is lost when faced with the need to coordinate efforts around various details. The amount of loss that happens in the various coordination efforts depends on the magnitude of the coupling between the units within the system. I personally prefer MPA without page modularization precisely because it minimizes the amount of coordination necessary.
Coordination is an inseparable part of teamwork, and highly desirable. However, the level at which you coordinate efforts is also an important consideration, as it can directly impact performance. In this particular example, the level was inadequate. Of course, I didn't modularize the page because I believed it was necessary – the amount of shared knowledge between the units we ended up with would immediately suggest that it's probably a bad idea to separate them. It was simply to demonstrate the technique – which, in and of itself, is perfectly fine, and works well.
In the next part, I'm going to revert all of this to a monolithic design. I'll briefly walk you through what advantages and disadvantages that has. Meanwhile, grab a copy of the current state of the code base.