Visualization using vanilla SVG (part 3)
In the previous part, I've added the auxiliary elements to the charts so that they look like proper charts: axes, ticks, grid. In this part, I'm going to finish the non-interactive parts of the charts by adding weather condition and wind direction icons, and the legend.
The weather condition icons
I want to display a weather condition icon for each date below the x-axis line. I will use the same pattern as the tick marks, therefore the most logical place to patch this code in is the tick marks block.
As usual, I'm going to split out some parameters that I expect to tweak later.
{ // Draw tick marks and labels, and weather icons
    let /* .... */
        iconSize = 32, // px
        iconOffset = 4 // px

    // ....
}
I've fixed the comment that describes the block to include a reference to
'weather icons', so I can find the code easily later. I've defined the
iconSize and iconOffset values, which represent the pixel dimensions of the
icons within the chart and the distance between the date label and the icon,
respectively.
The weather icons are going to be drawn alongside the horizontal ticks, so I'm updating that part of the code.
First I'm setting up some values that will hold for each iteration. While at it, I'm noticing there are y coordinates unnecessarily calculated each iteration, so I'm pulling them out of the loop. I'm also adding a y position for the icon.
{ // Horizontal ticks and weather icons
    let /* .... */
        tickY1 = paddingTop + plotHeight,
        tickY2 = paddingTop + plotHeight + tickLength,
        tickLabelY = paddingTop + plotHeight + tickLength + tickLabelGap,
        iconY = tickLabelY + 17 + iconOffset,
        // ....
        icons = svg.querySelectorAll('.weather-icon')

    for (let i = 0; i < numTickMarks; i++) {
        // ....
        tickMark.setAttribute('d', `M${tickX},${tickY1} L${tickX},${tickY2}`) // <-- fixed
        // ....
        tickLabel.setAttribute('y', tickY) // <-- fixed
    }
}
(Number 17 is the measured size of the label, hard-coded pending a better way to calculate it.)
Now on to drawing the icons.
{ // Horizontal ticks and weather icons
    // ....
    for (let i = 0; i < numTickMarks; i++) {
        // ....

        let iconId = getWeatherId(svg.weatherCodes[i]),
            icon = icons[i] ?? createSVGInside(svg, 'use', 'weather-icon')

        icon.setAttribute('href', `icons.svg#${iconId}`)
        icon.setAttribute('x', tickX)
        icon.setAttribute('y', iconY)
        icon.setAttribute('width', iconSize)
        icon.setAttribute('width', iconSize)
        icon.setAttribute('transform', `translate(-${iconSize / 2}, 0)`)
    }
}
There's one thing bugging me now, this:
icon.setAttribute('width', iconSize)
icon.setAttribute('width', iconSize)
These should be set once at creation, and not every update. The problem is
createSVGInside() doesn't support setting width and height attributes. I
have some options:
- Leave it as is. It's not a big deal.
- Add support for setting the
widthandheightby taking more parameters. - Add support for setting the
widthandheightby makingcreateSVGInside()more generic, and also disrupting the existing usages.
Given that the forecast API only returns up to 15 days, there's a physical limit to how demanding visualization is going to get for me. Not a lot. So leaving it as is a perfectly reasonable and pragmatic approach.
Going with the third option can potentially improve the code clarity (you'll see later), so it's a worthwhile endeavor. Making the code more generic has other benefits as well. Generic code tends to have less edge cases, for instance, as it captures a more complete relationship between input and output values. While the impact is not going to be as pronounced in this case, you'll notice the difference.
I don't have a much code right now, so updating existing usages is not a big trade-off. (I'd also like to emphasize that this is one of the reasons I avoid having too much code – it keeps the door open for these kinds of decisions.)
let /* .... */
    createSVGInside = (parentNode, tagName, attributes) => {
        let element = createSVG(tagName)
        for (let k in attributes) element.setAttribute(k, attributes[k])
        parentNode.append(element)
        return element
    }
I was previously accepting the class attribute as the third parameter. Now I'm
taking the attributes parameter which is an object. Since I iterate over the
attributes, I no longer need to test whether class is specified – or even
whether anything is passed – the beautiful thing about the for..in loop in
JavaScript is that it will not blow up if attributes is undefined or null,
and I don't need to handle those cases explicitly. (I wish they kept that design
for the for..of loop. Two steps forward, one step back, imho.)
With this, I can now do:
{ // Horizontal ticks and weather icons
    // ....
    for (let i = 0; i < numTickMarks; i++) {
        // ....

        let iconId = getWeatherId(svg.weatherCodes[i]),
            icon = icons[i] ?? createSVGInside(svg, 'use', {
                class: 'weather-icon',
                width: iconSize,
                height: iconSize,
            })

        // ....
    }
}
The result looks like this:
![]()
Wind direction
The wind direction icons are the little arrow icons that appear in the table view in the wind column. These are different from the weather icons in two ways:
- They are only used in the wind chart.
- They are drawn at the same spot as data points in the plot.
Running the same code for every chart would be wasteful when only wind chart requires it. I therefore have two options that I can think of:
- Create a separate function that adds the wind icons to the chart.
- Add an optional mechanism to the existing
drawChart()function.
Each option has its merits.
The first option has the merit of being isolated from drawChart(). It may
cater better to the specific needs I might have. It's a safer choice in the
sense that it doesn't require full awareness of what drawChart() is doing.
The second option is theoretically more efficient as drawing of the wind direction icons would piggyback on the iteration to draw the time series. More importantly, it would reuse the x and y axis calculations, which I won't need to extract.
I'll go with the second option, prioritizing cohesion of code related to plotting the series.
First I want to clean up the code a bit to prepare it for the main change. Reading it again, I see parts that could've been a bit better organized.
{ // Plot the series
    let /* .... */
        stepX = plotWidth / NUM_SEGMENTS,
        rangeYScale = plotHeight / (extent.max - extent.min),
        domainToRangeX = x => paddingLeft + x * stepX,
        domainToRangeY = y => paddingTop + plotHeight - Math.round((y - extent.min) * rangeYScale)

    for (let i = 0; i < timeSeriesList.length; i++) {
        let /* .... */
            x = domainToRangeX(0),
            y = domainToRangeY(ys[0]),
            d = `M${x},${y}`

        for (let i = 1; i < ys.length; i++) {
            x = domainToRangeX(i)
            y = domainToRangeY(ys[i])
            d += ` L${x},${y}`
        }

        // ....
    }
}
I've taken the domainToRangeY() outside the for loop as it does not rely on
any values inside the loop other than y, which it receives as a parameter.
I've also defined variables x and y to make the d attribute values a bit
clearer. They were a bit cluttered with inline calculations.
Now I can insert calls to an optional function that will be invoked for every data point in the series.
{ // Plot the series
    // ....

    for (let i = 0; i < timeSeriesList.length; i++) {
        // ....

        svg.onpoint?.(0, x, y)

        for (let i = 1; i < ys.length; i++) {
            svg.onpoint?.(i, x, y)
            d += ` L${x},${y}`
        }

        // ....
    }
}
The function takes the index, and x and y coordinates. I will use the index to
get the the wind direction data, and the coordinates to position the icon. The
code that adds the icons is going to live in the displayForecast() function.
{ // Draw wind direction icons
    let iconSize = 24,
        iconBackgroundSize = 14,
        iconOffset = iconSize / 2

    windChart.onpoint = (i, x, y) => {
        let icons = windChart.querySelectorAll('.wind-direction'),
            iconGroup = icons[i] || createSVGInside(windChart, 'g', {
                class: 'wind-direction',
                width: iconSize,
                height: iconSize,
            }),
            background = iconGroup.querySelector('circle') || createSVGInside(iconGroup, 'circle', {
                cx: iconOffset,
                cy: iconOffset,
                r: iconBackgroundSize,
            }),
            icon = iconGroup.querySelector('use') || createSVGInside(iconGroup, 'use', {
                width: iconSize,
                height: iconSize,
                href: 'icons.svg#wind-direction',
            }),
            windDirection = data.daily.wind_direction_10m_dominant[i + 1]

        iconGroup.setAttribute('transform', `
            rotate(${windDirection}, ${x}, ${y})
            translate(${x - iconOffset}, ${y - iconOffset})
        `)
    }
}
drawChart(windChart)
Let me walk you through it.
I create a block around the code so it doesn't leak variables. Namely, the following:
let iconSize = 24,
    iconBackgroundSize = 14,
    iconOffset = iconSize / 2
Again, tweakable variables that I figured I might need to mess with later. The background size refers to the radius of a circle within which the icon is drawn.
I add the function that draws the icon:
windChart.onpoint = (i, x, y) => {
    // ....
}
Within the function, I select all existing icons, and then reuse or create a group that will hold the icon and the background.
let icons = windChart.querySelectorAll('.wind-direction'),
    iconGroup = icons[i] || createSVGInside(windChart, 'g', {
        class: 'wind-direction',
        width: iconSize,
        height: iconSize,
    }),
    background = iconGroup.querySelector('circle') || createSVGInside(iconGroup, 'circle', {
        cx: iconOffset,
        cy: iconOffset,
        r: iconBackgroundSize,
    }),
    icon = iconGroup.querySelector('use') || createSVGInside(iconGroup, 'use', {
        width: iconSize,
        height: iconSize,
        href: 'icons.svg#wind-direction',
    }),
    windDirection = data.daily.wind_direction_10m_dominant[i + 1]
I've retrieved the wind direction value and stored it in a variable for later usage.
Lastly, I'm updating the position of the group according to the data.
iconGroup.setAttribute('transform', `
    rotate(${windDirection}, ${x}, ${y})
    translate(${x - iconOffset}, ${y - iconOffset})
`)
In short, the two transforms will rotate the icon to point in the same direction as the wind, and move it to the (x, y) coordinates, but such that the group is centered over it.
The CSS looks like this:
x-weather-forecast .chart .wind-direction circle {
    stroke: var(--chart-wind-color);
    fill: var(--background-color);
}

x-weather-forecast .chart .wind-direction use {
    --icon-stroke: var(--chart-wind-color);
}
Here's what it all looks like:
![]()
Legend
The legend does not need to be placed inside the <svg> element.
- It's just a look-up table for the colors used in the chart.
- It doesn't have to precisely align with anything in the chart.
- It doesn't rely on any information that is only available during the drawing of the chart.
For these three reasons, I'm better off doing the legend outside the <svg>
element – in plain HTML and CSS.
Since these charts have predetermined time series, I can hard-code the legend in
the <figcaption> element.
<figcaption>
    <span class="alt-text">Temperature chart</span>
    <ul class="legend">
        <li>Maximum temperature</li>
        <li>Minimum temperature</li>
    </ul>
</figcaption>
The color isn't indicated in HTML. That's going to be done in the CSS. On the
other hand, I'm now noticing I don't have viable hooks to select specific <li>
elements. For that, I'll need to lift the chat-specific classes like
.temperature-chart from the <svg> element onto the <figure> element, which
is the common ancestor.
<figure class="temperature-chart">
    <svg class="chart" viewBox="0 0 100 100" xmlns="http://www.w3.org/2000/svg"></svg>
    <!-- .... -->
</figure>
In this example, I've moved the .temperature-chart class from the <svg>
element to the <figure> element, which now allows me to select the legend
<li> items specific to this chart. I need to fix the JavaScript to reflect
this:
let /* .... */
    temperatureChart = this.querySelector('.temperature-chart .chart'),
    precipitationChart = this.querySelector('.precipitation-chart .chart'),
    windChart = this.querySelector('.wind-chart .chart')
I've changed the .temperature-chart selector to .temperature-chart .chart.
Although HTML and JavaScript are loosely coupled, they are still coupled. The coupling is through custom elements and selectors. Therefore, if you make a change that would require a change in the selector, you obviously will need to edit in two places rather than just one.
Although my approach generally aims to minimize the times when I have to edit in
two places, there's an even more systematic approach that was conveyed to me by
Eugene Baziak: use classes as selectors in CSS, use data attributes as selectors
in JavaScript. For instance, in this particular case, I'd have a
data-id="temperature-chart" or something on the <svg> element, and select it
in JavaScript using [data-id=temperature-chart], and I wouldn't need to change
JavaScript in order to move that class. In this blog series, I specifically
avoided this superior approach because I thought it may look a bit weird to
people who are not used to exploiting the full range of selectors. I admit I
have likely overthought this. As a result, though, I now have a good opportunity
to show you what problem Eugene's approach solves, so it wasn't all bad. Moving
on...
Next, I'm doing the styling for the legend. The base style looks like this:
x-weather-forecast .legend {
    display: flex;
    flex-wrap: wrap;
    gap: 1em;
    padding: 1em;
}

x-weather-forecast .legend li {
    display: flex;
    gap: 0.2em;
    align-items: center;
    font-size: 87.5%;
    text-transform: lowercase;
}

x-weather-forecast .legend li::before {
    content: '';
    display: inline-block;
    vertical-align: middle;
    width: 0.875em;
    aspect-ratio: 1;
    border-radius: 50%;
    background: var(--color);
}
It sets the layout, font size, and other common properties, and it leaves
the --color custom property for me to specify the colors.
In order to be able to reuse the custom properties for colors, I need to lift
them up first. They are currently scoped to .chart (the <svg> elements).
x-weather-forecast {
    /* .... */
    --chart-temperature-min-color: rgb(119, 163, 245);
    --chart-temperature-max-color: rgb(229, 30, 30);
    --chart-precipitation-color: rgb(4, 156, 173);
    --chart-wind-color: rgb(36, 188, 74);
    /* .... */
}

@media (prefers-color-scheme: light) {
    x-weather-forecast {
        --chart-temperature-min-color: rgb(18, 64, 149);
        --chart-temperature-max-color: rgb(138, 5, 5);
        --chart-precipitation-color: rgb(4, 89, 99);
        --chart-wind-color: rgb(10, 89, 30);
        --chart-grid-line-color: #999;
    }
}

x-weather-forecast .chart {
    aspect-ratio: 2;
}
The aspect-ratio property remains with the .chart element.
Now I can apply the colors to the legend items:
x-weather-forecast .temperature-chart .legend li:first-child {
    --color: var(--chart-temperature-max-color);
}

x-weather-forecast .temperature-chart .legend li:last-child {
    --color: var(--chart-temperature-min-color);
}

x-weather-forecast .precipitation-chart .legend li:first-child {
    --color: var(--chart-precipitation-color);
}

x-weather-forecast .wind-chart .legend li:first-child {
    --color: var(--chart-wind-color);
}

x-weather-forecast .wind-chart .legend li:last-child x-icon {
    --icon-stroke: var(--chart-wind-color);
}

x-weather-forecast .wind-chart .legend li:last-child::before {
    display: none;
}
The last block is needed because the last legend item in the wind chart is for the wind icon, and it doesn't need the circle that represents the color.
The result looks like this:
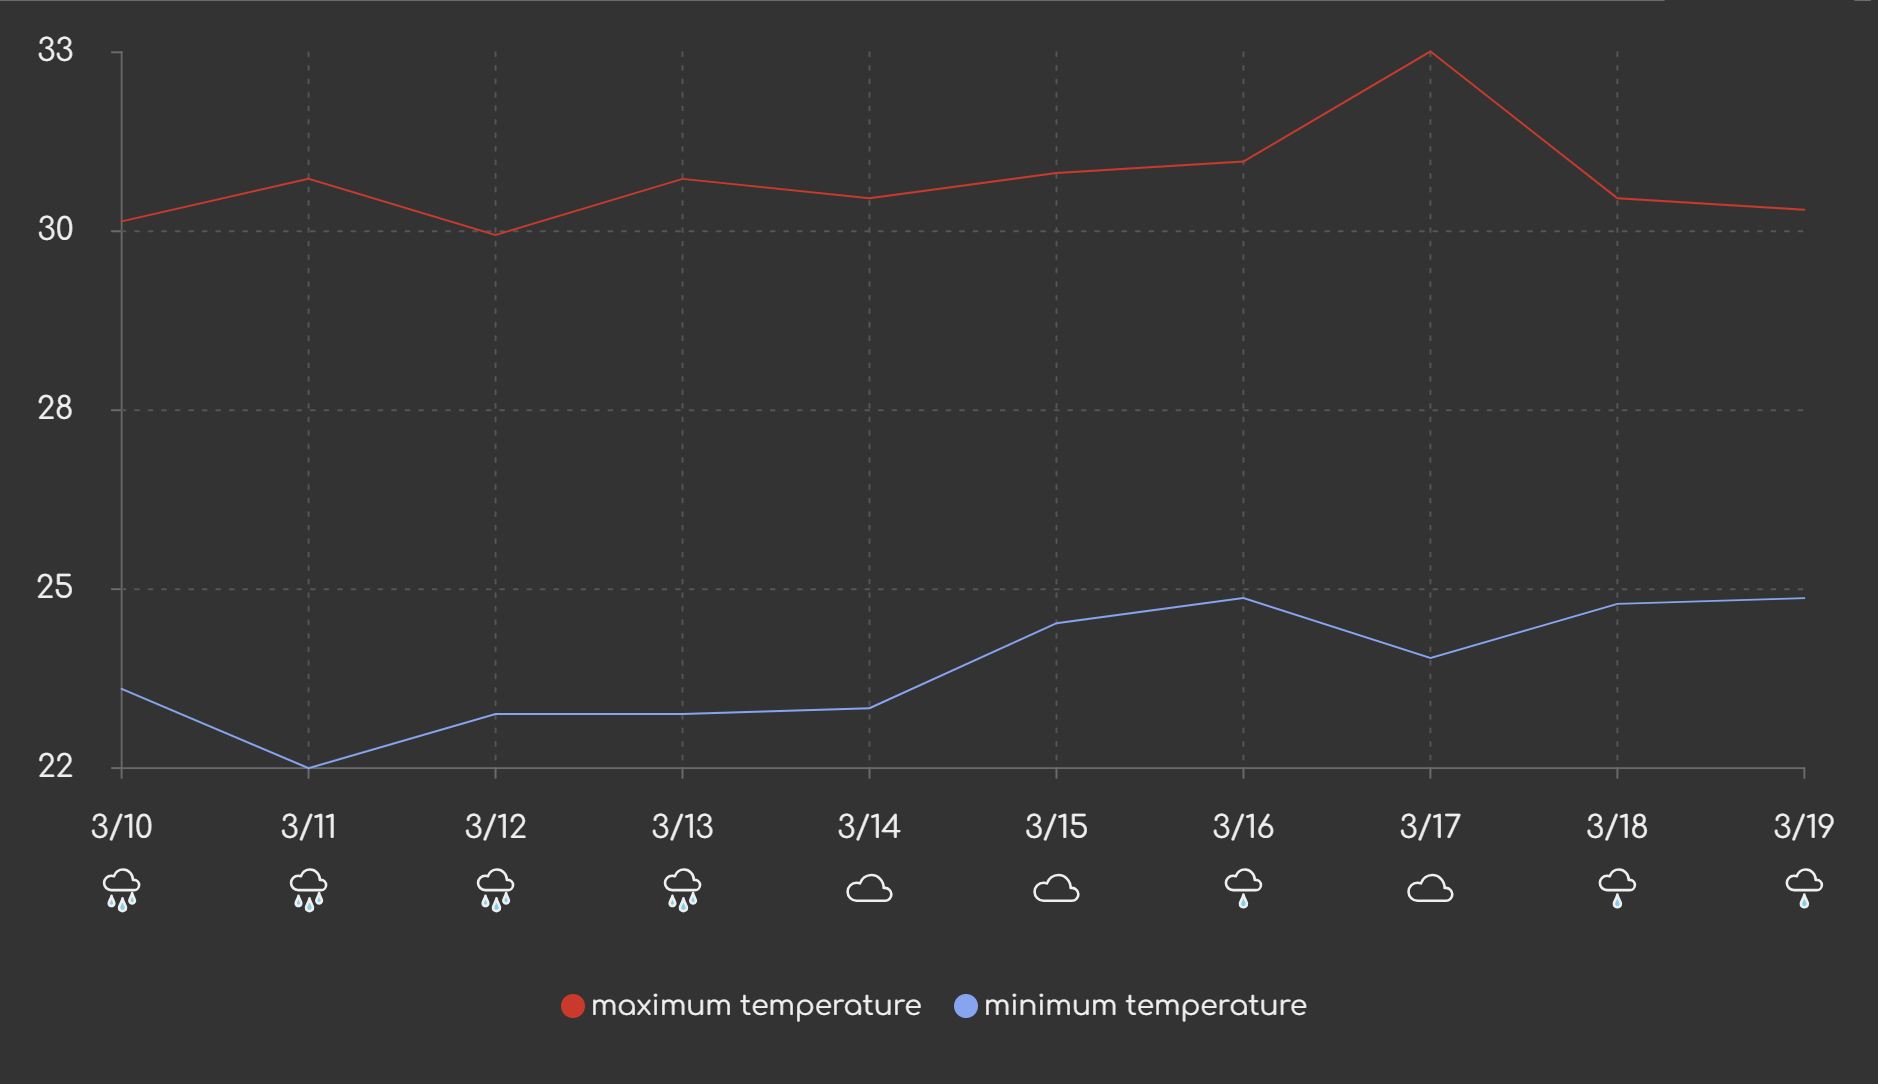
Conclusion
With this part, I conclude the work on the visualization. In the intro, I used the phrase 'non-interactive' suggesting that I might do the chart interaction next. But after three parts, I'm feeling the need to move on to another topic. Therefore, in the next part, I'll be tackling offline support and PWA conversion. I'll come back to the charts later.
Check out the live version to see the current state in action.